Where Pickleball Tournament Listings Grew Fastest in 2026
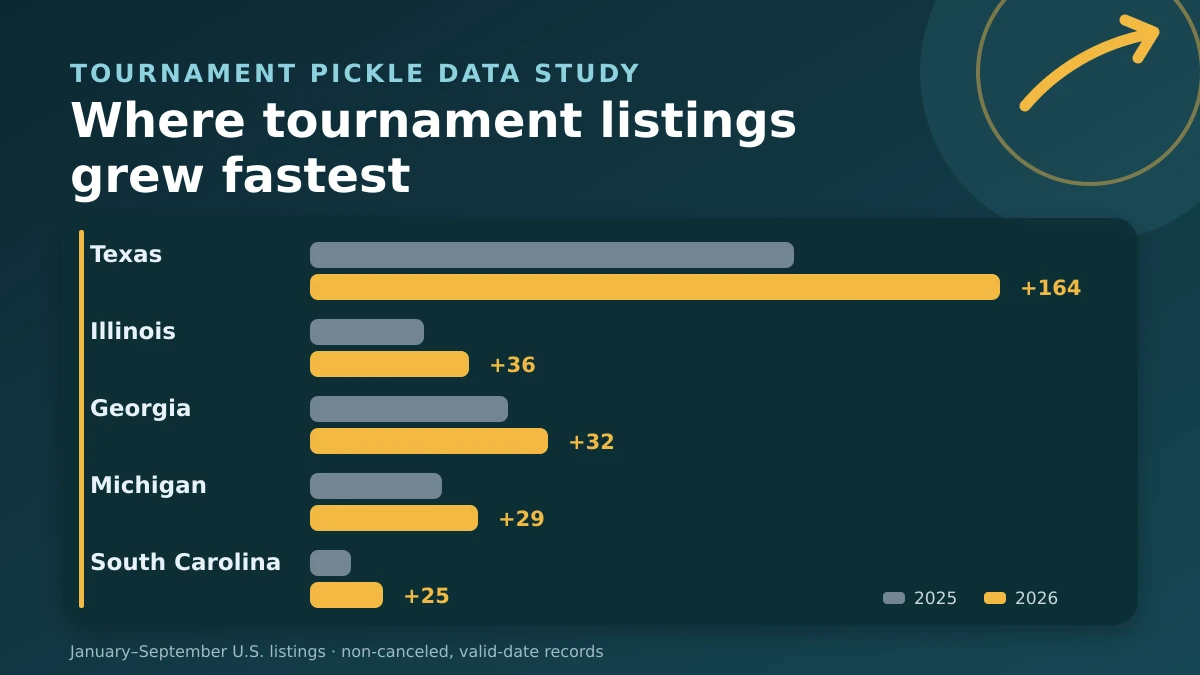
Texas posted the largest increase in U.S. pickleball tournament listings in 2026. Tournament Pickle counted 550 non-canceled Texas listings scheduled from January through September, up from 386 in the same months of 2025. That is an increase of 164 listings, or 42.5%. South Carolina had the fastest percentage growth among states with at least 20 listings in the 2025 comparison period, rising 75.8% from 33 to 58.
Those results describe listings in Tournament Pickle’s index, not every tournament played and not a census of pickleball participation. The distinction matters: registration platforms change, organizers can list recurring events separately, and a larger index does not prove that the number of players grew at the same rate. Still, a consistent year-over-year comparison shows where players are seeing meaningfully more competitive options.
The national picture: 13.4% more listings
We analyzed 6,351 U.S. tournament records with start dates from January through September: 2,976 in 2025 and 3,375 in 2026. The 2026 total was 399 listings higher, a 13.4% increase. Records marked canceled, records with questionable dates, and records without a valid U.S. state were excluded. The database was queried on September 29, 2026; already-listed events scheduled for September 30 were included in both calendar-month windows.
Texas alone supplied 164 of the 399 additional listings, or 41.1% of the net national gain. No other state added more than 36. That makes Texas the clearest answer to the question “where did tournament choice expand most?” It does not mean every Texas market grew equally, however. Much of the increase was concentrated around greater Houston and Dallas-area suburbs.
| State | Jan–Sep 2025 | Jan–Sep 2026 | Change | Growth |
|---|---|---|---|---|
| Texas | 386 | 550 | +164 | +42.5% |
| Illinois | 91 | 127 | +36 | +39.6% |
| Georgia | 158 | 190 | +32 | +20.3% |
| Michigan | 105 | 134 | +29 | +27.6% |
| South Carolina | 33 | 58 | +25 | +75.8% |
| New York | 113 | 135 | +22 | +19.5% |
| Tennessee | 60 | 81 | +21 | +35.0% |
| Maryland | 68 | 88 | +20 | +29.4% |
We required at least 20 listings in the 2025 baseline before ranking percentage growth. That prevents a state moving from two events to six from appearing to be the national leader on a 200% increase. The threshold leaves smaller markets visible without letting tiny denominators dominate the result.
Texas added the most tournament choice
Texas was already the highest-volume state in this comparison, then widened the gap. Its gain was larger than the combined gains of Illinois, Georgia, Michigan, and South Carolina. Players can explore the current schedule on the Tournament Pickle tournament finder or use our Texas tournament guide for a state-specific starting point.
The city data explains part of the jump. Missouri City rose from 33 listings to 71, Houston from 54 to 70, Tomball from 3 to 25, Plano from 2 to 20, and Sugar Land from 21 to 32. These are listing counts, so a busy organizer or venue offering a series can move a city sharply. They should be read as evidence of more calendar inventory, not as five separate measures of unique clubs, facilities, or players.
South Carolina led in percentage growth
South Carolina increased from 33 listings to 58, a gain of 25 and the fastest percentage rise among states clearing the baseline. Texas was second at 42.5%, North Carolina third at 40.0% (45 to 63), and Illinois fourth at 39.6% (91 to 127). Tennessee followed at 35.0%.
Absolute and percentage growth answer different questions. Absolute growth tells a player where the calendar gained the most options. Percentage growth highlights a smaller market changing quickly. South Carolina’s 25 additional listings are meaningful, but Texas added more than six times as many. Both facts belong in the same ranking.
The other states adding substantial volume
Illinois: broad growth from an established base
Illinois moved from 91 to 127 listings, up 36 or 39.6%. That combination of a solid baseline and a strong percentage gain is more persuasive than a spike from a very small starting point. Romeoville was one visible local contributor, increasing from 2 to 11 listings in the index.
Georgia: high volume plus another step up
Georgia added 32 listings, reaching 190. Lawrenceville increased from 1 to 21, Atlanta from 9 to 18, and Alpharetta from 3 to 12. Georgia’s statewide growth rate, 20.3%, was less dramatic than South Carolina’s, but its 2026 schedule was more than three times as large.
Michigan, New York, Tennessee, and Maryland
Michigan added 29 listings, New York 22, Tennessee 21, and Maryland 20. A few city clusters stand out: Binghamton had 25 indexed listings after none in the prior comparison window, Memphis rose from 5 to 19, and Gaithersburg from 1 to 16. Zero-to-something city changes are useful discovery signals, but they are not suitable for percentage rankings because the denominator is zero.
Population changes the view
Raw totals favor large states, so we also divided 2026 listings by the U.S. Census Bureau’s 2025 state population estimates. Among states with at least 20 listings in 2026, Minnesota led this index-density view at 19.0 listings per million residents. Texas followed at 17.3; Georgia and Colorado were both 16.8; Maryland was 14.0.
Per-capita density is not the same as growth. Minnesota’s count increased a modest 11.0%, from 100 to 111, but its population-adjusted tournament inventory was the highest in the qualifying group. The population figures come from the Census Bureau’s 2025 state estimates dataset; readers interested in how those estimates are produced can review the Bureau’s population-estimates methodology.
How to use the findings
If you want the deepest calendar and the largest year-over-year gain, start with Texas. If you are looking for a smaller market whose indexed schedule changed fastest, look at South Carolina. Illinois and Georgia offer the strongest middle ground: substantial existing calendars with meaningful additional volume.
For travel planning, do not choose a destination from annual counts alone. Check exact dates, division availability, registration status, venue location, and whether your preferred format is offered. Our earlier analysis of the best cities for pickleball tournaments focuses on overall tournament volume and event size, while this study isolates year-over-year listing change. Those are related but distinct questions.
Likewise, tournament supply is not player participation. Our state participation analysis uses player data and a different denominator. A state can have a dense player base without posting the largest tournament-calendar gain, and a new venue series can increase listings before the broader player population changes measurably.
Methodology and limitations
This Tournament Pickle analysis was run on September 29, 2026. It compared tournament start dates in January through September 2025 with the same calendar months in 2026. We included U.S. records with a valid state and excluded canceled tournaments and records flagged for questionable dates. The final sample was 6,351 listings: 2,976 in 2025 and 3,375 in 2026. One stored tournament document counted as one listing.
The index drew primarily from PickleballTournaments listings in both periods, with UTR and a smaller number of Pickleball Den records also present. Source composition was not identical: the 2025 sample contained 2,826 PickleballTournaments listings and 150 UTR listings; the 2026 sample contained 3,244 PickleballTournaments listings, 94 UTR listings, and 37 Pickleball Den listings. Platform coverage, late additions, duplicate handling, recurring series, and organizer behavior can all affect the comparison. For that reason, we describe growth in indexed listings, not growth in all tournaments or participation.
Frequently asked questions
Which state added the most pickleball tournament listings in 2026?
Texas added the most. Tournament Pickle counted 550 January-through-September 2026 listings, 164 more than the 386 counted in the same months of 2025.
Which state had the fastest percentage growth?
South Carolina grew fastest among states with at least 20 listings in the 2025 baseline. Its count increased from 33 to 58, or 75.8%.
Does this prove pickleball participation grew fastest in Texas?
No. The analysis measures tournament listings in Tournament Pickle’s index. It does not directly measure unique players, facilities, organizers, or total participation.
Why compare January through September instead of full years?
At the analysis date, 2026 was not complete. Matching the same calendar months avoids comparing a partial 2026 with a full 2025, although later additions can still revise either total.